

As we have discussed in prior communications, the Fed has been aggressively hiking interest rates in order to slow down the economy and get inflation under control, and it is making no mystery of the fact that it is willing to cause a recession if that is what it takes. As a result, a recession is now widely expected by investors as well as the general public. An August survey by the Conference Board found that 41% of US workers believe the economy is already in a recession. And as we wrote recently, our proprietary model is indicating that the probability of a recession over the next 18 months is 3x higher than normal, which historically has always resulted in a recession. So, while a recession seems almost a given at this point, what does that imply for the stock market?
One statistic that is often thrown around is that stocks tend to experience deeper and longer-lasting drawdowns during recessions as opposed to outside of recessions. However, even stock market declines associated with recessions can vary wildly depending on the severity of the recession, with more severe recessions being associated with deeper and longer-lasting stock market declines compared to milder recessions. To illustrate this point, we first need to define what constitutes a severe recession. The table below lists all the recessions the US economy has experienced since 1960, and reports the duration of each as well as its magnitude, as measured by the peak-to-through decline in the Conference Board Coincident Economic Index (CEI). This information is shown in the blue columns. The CEI is a higher-frequency measure of economic activity than GDP (monthly instead of quarterly), which allows us to more timely and accurately identify the turns in the business cycle.
According to this data, the typical (i.e. median) recession since 1960 lasted 11.1 months and was associated with a 2.9% decline in economic activity. Based on this information, we can define a severe recession as one that was both longer and deeper than usual. In other words, we defined a severe recession as one that lasted longer than 11.1 months AND resulted in a larger than 2.9% decline in economic activity. This set of criteria results in three recessions being labeled as severe, which are highlighted in red: 1973-1975, 1981-1982, and 2007-2009. By contrast, all other recessions on the list are labeled as mild. Notably, the 2020 recession was the one that saw the deepest drawdown in the CEI but also the shortest duration, and as a result was not labeled as severe according to our definition.
US Recessions Since 1960 and Associated S&P 500 Drawdowns
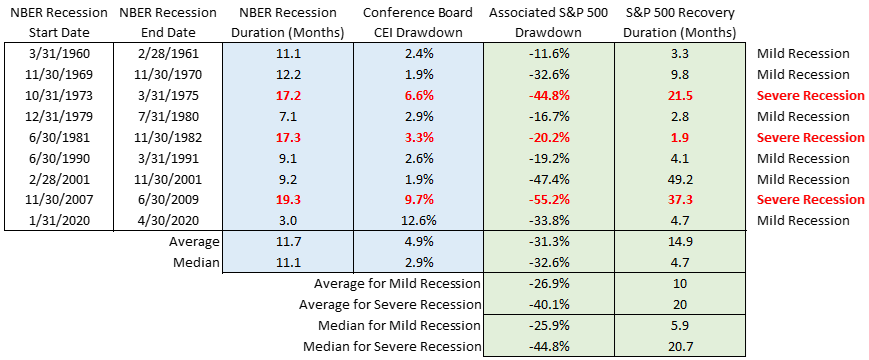
In order to prove our point, the next step involved identifying the stock market declines that were associated with each of these recessions. The green columns on the chart above report the peak-to-trough drawdown of such declines as well as duration of the ensuing recovery, based on the S&P 500 total return index. The median drawdown across the sample was -32.6%, which is roughly in line with results from other studies of recessionary market declines. The median time to recovery was 4.7 months, though the average recovery took over three times as long, 14.9 months. What we are most interested in, however, is that market declines associated with severe recessions (-40.1% on average) were much deeper than market declines associated with mild recessions (-26.9% on average). Moreover, the S&P 500 index recovered its losses much faster following mild recessions (10 months on average) compared to severe recessions (20 months on average). For reference, as we are writing this, the S&P 500 index is down roughly 24% from its January peak, which is less than 3% away from the average decline during mild recessions.
Why is this important? While a 2022-2023 recession may be a given, we expect it to be relatively mild. Severe recessions tend to result from significant excesses and imbalances in the economy, which are hard to find at the moment. Consumer balance sheets are healthy after over a decade of deleveraging and pandemic-related income assistance more recently. Leverage is greater in the corporate sector, but companies have been able to refinance and extend their debt at record-low rates. Credit quality in the housing market is strong thanks to more stringent standards following the housing crisis, and the banking system is well capitalized. Finally, thanks to its status as an oil exporter, the US economy is relatively insulated from the energy crisis that has been gripping Europe. All this suggests a mild recession might be in the cards.
The bottom line is this: the market has already discounted a lot of pessimism. If we are right and the recession proves to be relatively mild, there should not be much more to discount and the bottom should be near.
Below are a couple of charts that will provide more context and better visuals of the data we have been working with. Please let us know if you have any comments or questions.
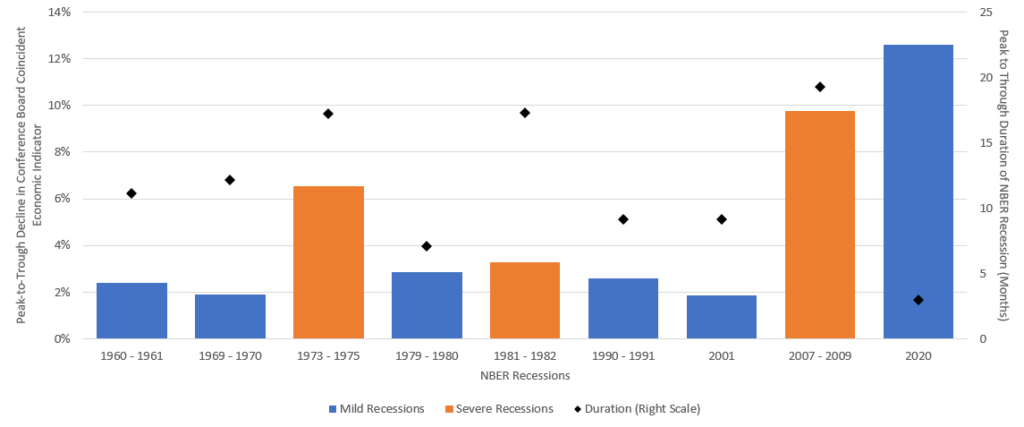
The bars on the chart below plot the CEI drawdown associated with each recession (measured on the left scale), with severe recessions highlighted in orange. The black dots indicate the duration of the recession (measured on the right scale).
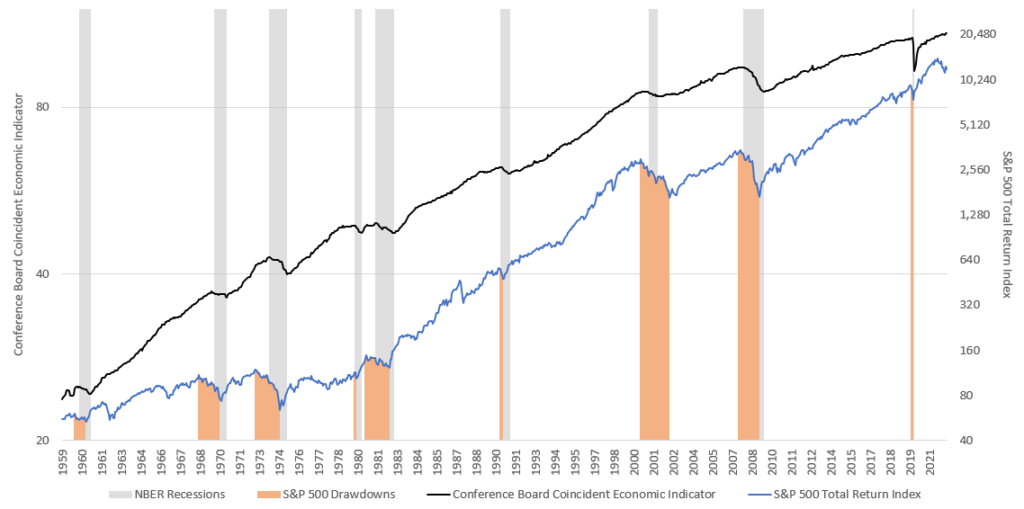
The chart below plots the S&P 500 total return index (in blue) with its recessionary drawdowns (in orange), the CEI (in black), and NBER recessions (grey).
Sauro Locatelli CFA, FRM™, SCR™
Director of Quantitative Research
Congress Wealth Management LLC (“Congress”) is a registered investment advisor with the U.S. Securities and Exchange Commission (“SEC”). Registration does not imply a certain level of skill or training. For additional information, please visit our website at congresswealth.com or visit the Investment Adviser Public Disclosure website at www.adviserinfo.sec.gov by searching with Congress’ CRD #310873.
This note is provided for informational purposes only. Congress believes this information to be accurate and reliable but does not warrant it as to completeness or accuracy. This note may include candid statements, opinions and/or forecasts, including those regarding investment strategies and economic and market conditions; however, there is no guarantee that such statements, opinions and/or forecasts will prove to be correct. All such expressions of opinions or forecasts are subject to change without notice. Any projections, targets or estimates are forward looking statements and are based on Congress’ research, analysis, and assumption. Due to rapidly changing market conditions and the complexity of investment decisions, supplemental information and other sources may be required to make informed investment decisions based on your individual investment objectives and suitability specifications. This note is not a complete analysis of all material facts respecting any issuer, industry or security or of your investment objectives, parameters, needs or financial situation, and therefore is not a sufficient basis alone on which to base an investment decision. Clients should seek financial advice regarding the appropriateness of investing in any security or investment strategy discussed or recommended in this note. No portion of this note is to be construed as a solicitation to buy or sell a security or the provision of personalized investment, tax or legal advice. Investing entails the risk of loss of principal.


Comments are closed.